

Deepest Downs. When trading stock, a feature on E-Trade and similar stock market trading platforms used to identify the deepest dips by dollar amount.
For example…
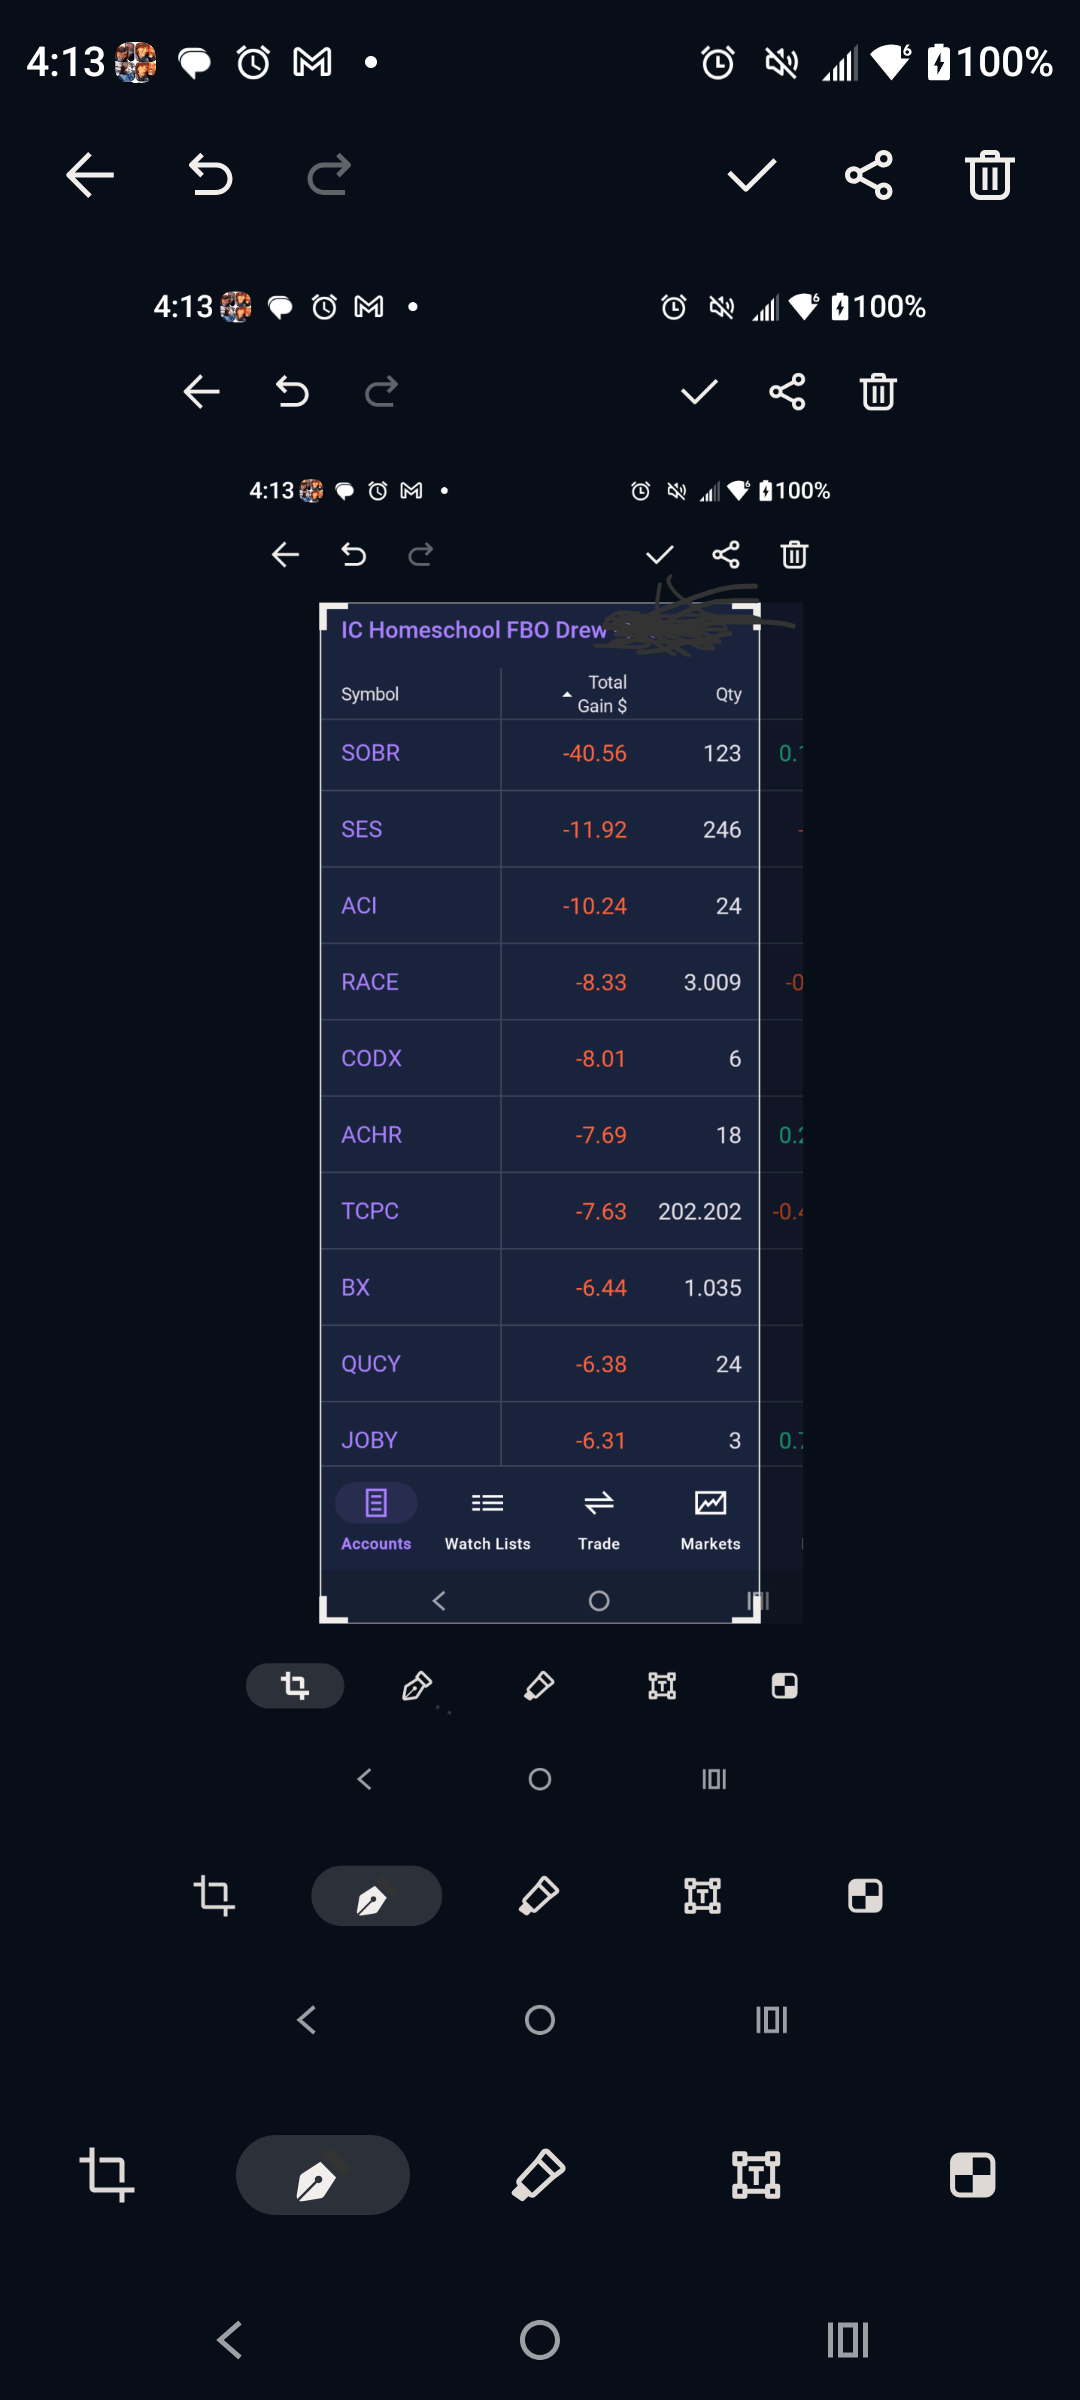
Shortly after the close of the market [trade day] at 4pm EST with Daylight Savings Time applied, the following stock list represents my financial losses ($+/-) with column sorted showing Deepest Downs in the color known as RED.
The word SYMBOL is the name of the column that shows the call letters of stocks, bonds, ETFs, etcetera.
Total Gain is how much money was accrued or spent as a loss. In this case, the stocks shown represent the deepest down stocks with the largest — also known as deepest — loss being sorted at the head (meaning top) of the column.
Smaller losses, therefore (meaning under $0.00 amounts understood as loss or debt in banking or on a Money Market Account worksheet) appear towards the opposite meaning juxtaposed column end.
If you were teaching homeschool, a student could then be asked to identify the column and share correct answers about actual loss. In this case, SOBR stock is down the most.
Stocks down indicate an opportunity to make money if you sold high and returned to buy low. Penny Stocks — meaning stocks under $5 — are often traded by Sock Brokers and Stock Owners who self manage accounts.
When deciding at the end of the day what to sell, most Day Traders are likely to consider buying up their Deepest Downs or selling at a lost to a oud accruing interest on any monies borrowed using the cash for credit based current margin system.

You must be logged in to post a comment.